Graph to display 'mapping changes counts'
Mapping rate of change is an important metric to determine overall project health as well as the basis for potential change orders. If the rate of mapping changes is very high late in a project or as you approach a go live, you can expect that volatility will lead to unexpected results, incomplete mappings, and failed validations. Also, as you look for reasons why change orders might be needed, extra or unexpected work late in a project related to mappings can form the basis for a factual discussion with the customer about the need.
It is an important metric to keep track of in every project - and I believe (but am not certain) that the ‘History’ icon in mapping would provide the basis for this graph. If you click here, you’ll see ‘Object History’ at the column level. I think every time you make a change to a mapping, a record is inserted here.
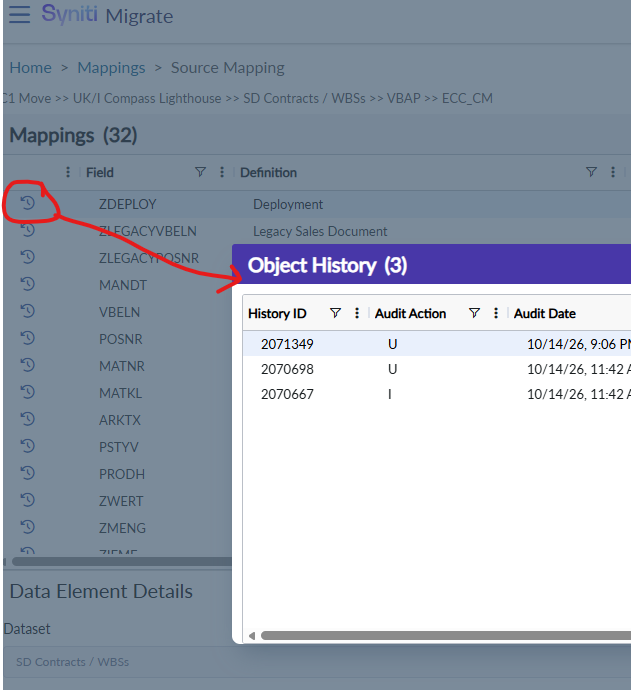
So the graph would take these records and “roll them up”.
X axis - Time - either daily, weekly, or monthly. Maybe that would be configurable?
Y axis - Count
This graph would be useful to display/roll up at all levels: source, target, dataset, release
You would also want to take into account things like the ‘Active’ button being on/off for a given source, target, and/or dataset.
Log in to comment and vote
Comments2
nikhileshshirsale
Nov 11
Thanks Jay, for the feedback, We will review and get back on this in case of any doubt.
jay.hornback@syniti.com
Oct 20
*I’m not sure of the best place for these charts to live. It’s something we would need to poll delivery to figure out where it would be most useful. We may also want it to play into the “mock readiness” calculation on the PMO dashboard.